Old iPad as Dashboard
How the old tablet is moving into the modern dashboard.
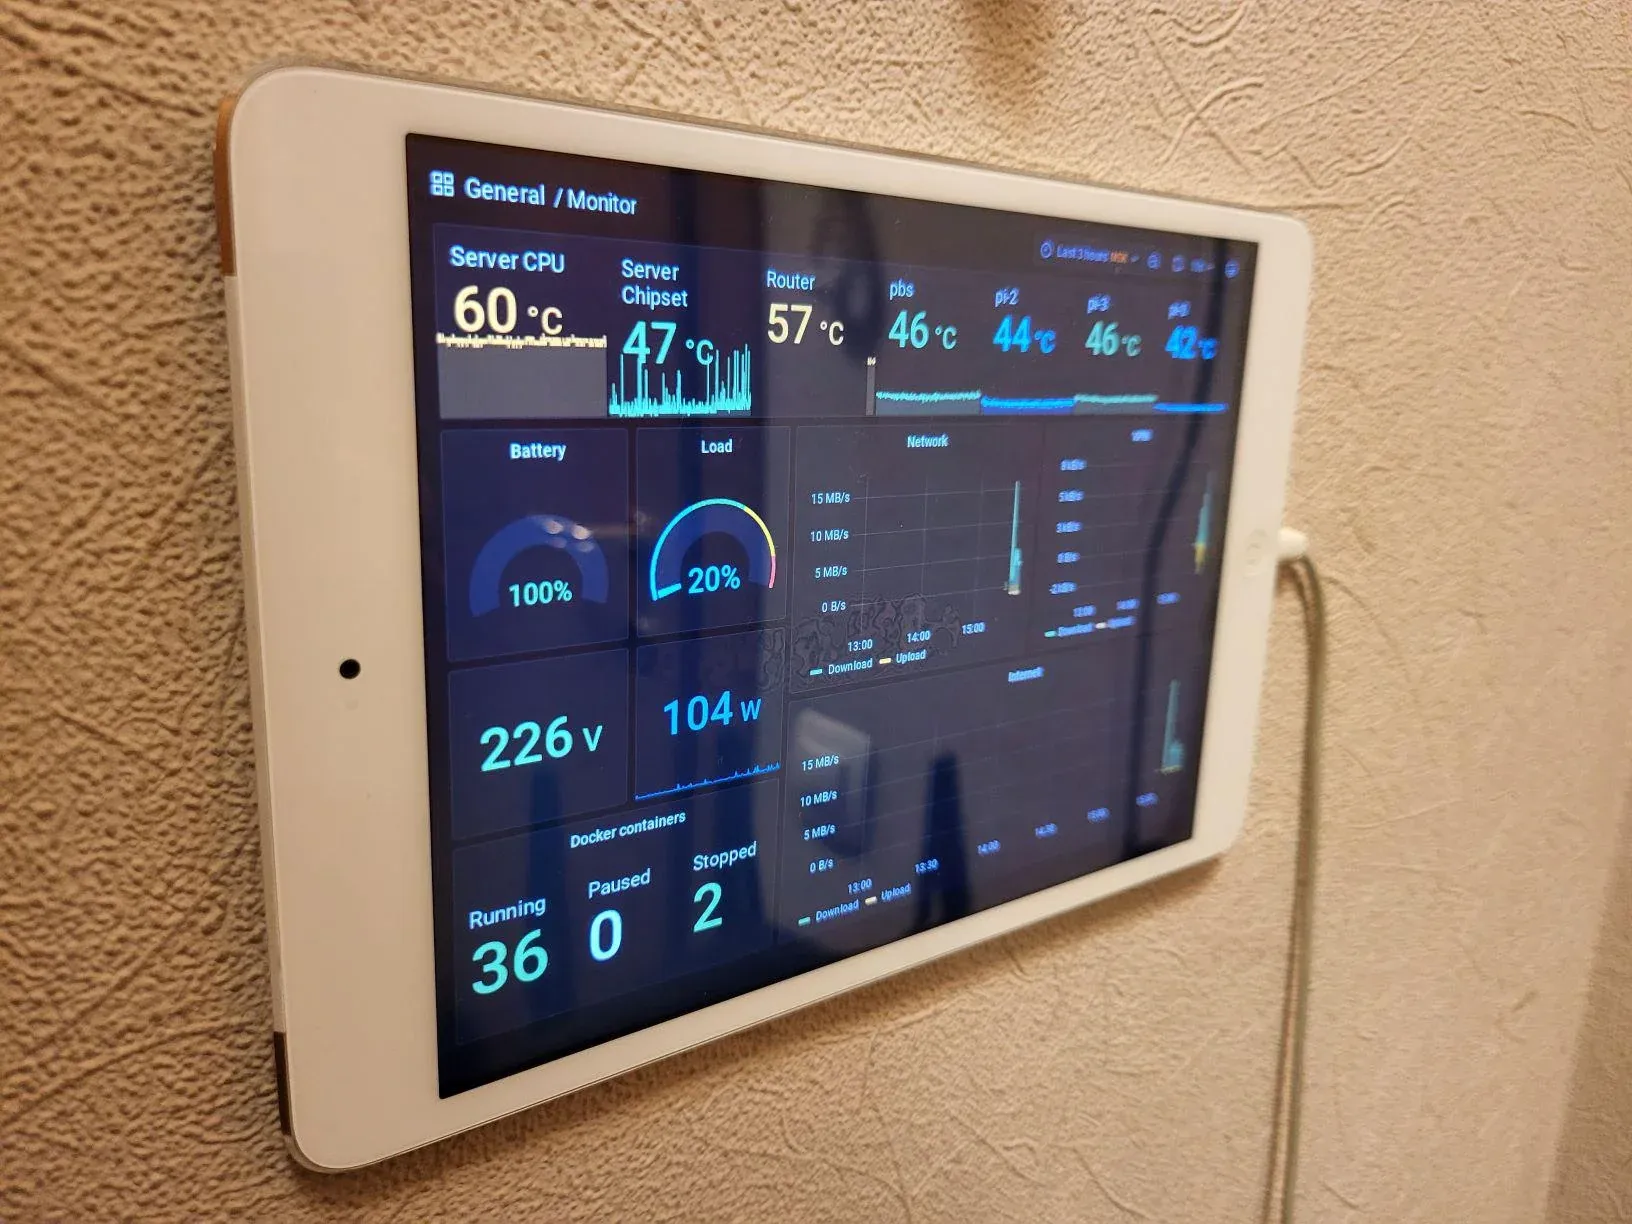
As we know, older Apple devices after the end of support quickly lose functionality. I have one of these devices - "iPad Mini 1", which despite of it's advanced age was still ok. I thought it would make a great dashboard for my mini server rack. This is where the adventure begins.
Problems
- Safari completely refuses to navigate to pages with a port specified, which means that the dashboard must be available on standard ports
80/443. We will use nginx in front. - iOS 9 contains legacy root certificates, which, fortunately, can be easily installed. Because my home services are running on LE-certificates, this option came in handy.
- Most modern dashboards use JS features not yet available on such older devices. Attempts to open Uptime Kuma or Grafana failed as expected. All browsers on iOS use WebKit in one way or another, which means that an attempt to replace the browser with another cannot in any way. I even tried JB and searched for a third party browser. I struggled with the repositories for a long time and could not find anything suitable. I also tried Puffin Web Browser, which renders on remote servers, but even with access from outside, Puffin couldn't render the page. But the logic of Puffin's work pointed the direction of further search.
- Searching led me to the open source project WRP. This is a browser-in-browser "proxy" server that allows to use old web browsers on the modern web. It works by rendering a web page in to a GIF or PNG image with a clickable imagemap.
Solution
- Install ISRG Root X1 certificate on iPad - https://letsencrypt.org/certs/isrgrootx1.pem.
- Create a Dashboard in Grafana, set the refresh period. 10 seconds is enough for me, in your case there may be a different value.
- Create an html page with the following content, remembering to specify the address and a similar refresh period in the
AutoRefresh()function:
<html>
    <head>
        <title>Monitoring {{.URL}}</title>
        <script type="text/JavaScript">
            function AutoRefresh() {
                var frm = document.getElementById("browser");
                // I recommend using the same refresh as the dashboard
                // 10000ms = 10s
                setTimeout(function () { frm.submit("Go"); }, 10000);
            }
        </script>
        {{if .ImgURL}}
        <style>
            body {
                background: url({{.ImgURL}});
                background-repeat: no-repeat;
                background-size: {{.Width}} {{.Height}};
            }
            #browser {
                display: none;
            }
        </style>
        {{end}}
    </head>
    <body bgcolor="{{.BgColor}}" onload="JavaScript:AutoRefresh();">
        <form acrion="/" method="post" id="browser">
            <input type="text" NAME="url" value="https://grafana.your.domain/d/xDtvaft4k/monitor?kiosk=tv&refresh=10s" size="20">
            <input type="submit" value="Go" name="Go">
        </form>
    </body>
</html>
3. Run the WRP container by specifying the screen resolution of your device and the folder with the previously created file.
docker run -d \
	--cpus=1 \
	-m=2g \
	-p 8080:8080 \
	-v /docker/wrp:/wrp-html \
	--name wrp \
	tenox7/wrp -t png -g 1024x768x256 -ui /wrp-html/wrp.html
4. Place the WRP container behind Nginx with a valid certificate.
5. Open in a browser in full screen mode or in the application Kiosk Mode for iPad (still compatible with iOS 9).
You can use this workaround to display any incompatible sites, this was just a specific example with Grafana.